
7. Watch Training and Read the Results
📍 Where you are: Task Owner 7/7 — ① Design → ② Create Task → ③ Workspace → ④ Train · publish → ⑤ Approve → ⑥ Campaign → ⑦ Results
Screen: FedOps Console · Other side: the Client is taking part in rounds · Next: (optional) Model Use Track
🎯 What you do in this step: Watch rounds progress and, when they finish, read the new Global Model and its metrics. Then confirm on screen that “federated learning ran and the two hospitals’ training was merged”. The Owner sees the state of all participants; each Client sees only its own.
1) Watch progress
Rounds start once Clients per round Clients have connected. The live log you opened in chapter 6 shows rounds advancing. Whoever connects first waits in Studio as waiting_round, and rounds proceed once the second participant connects. In the 2026-10-20 run, the two rounds finished in 3 seconds after both hospitals connected (live log: Run finished 2 round(s)). Most of the time is spent waiting for both participants to be ready (checks and connection).
When training ends, the server shuts down by itself and becomes Server Offline.
Then look at the results in the Console.
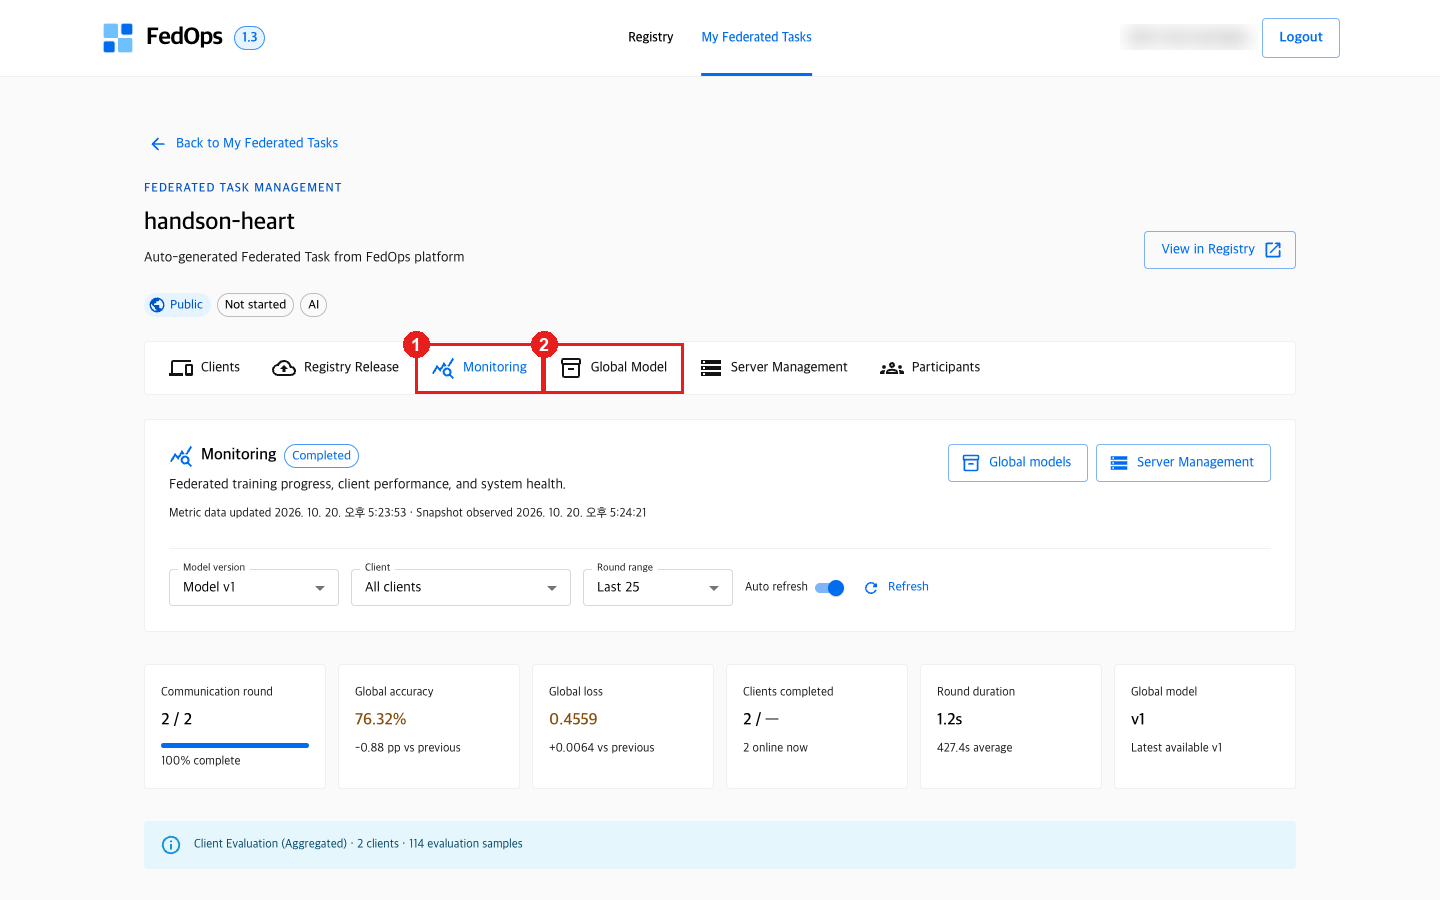
- In the Console’s
handson-heart, click the Monitoring tab. - When done, click the Global Model tab.
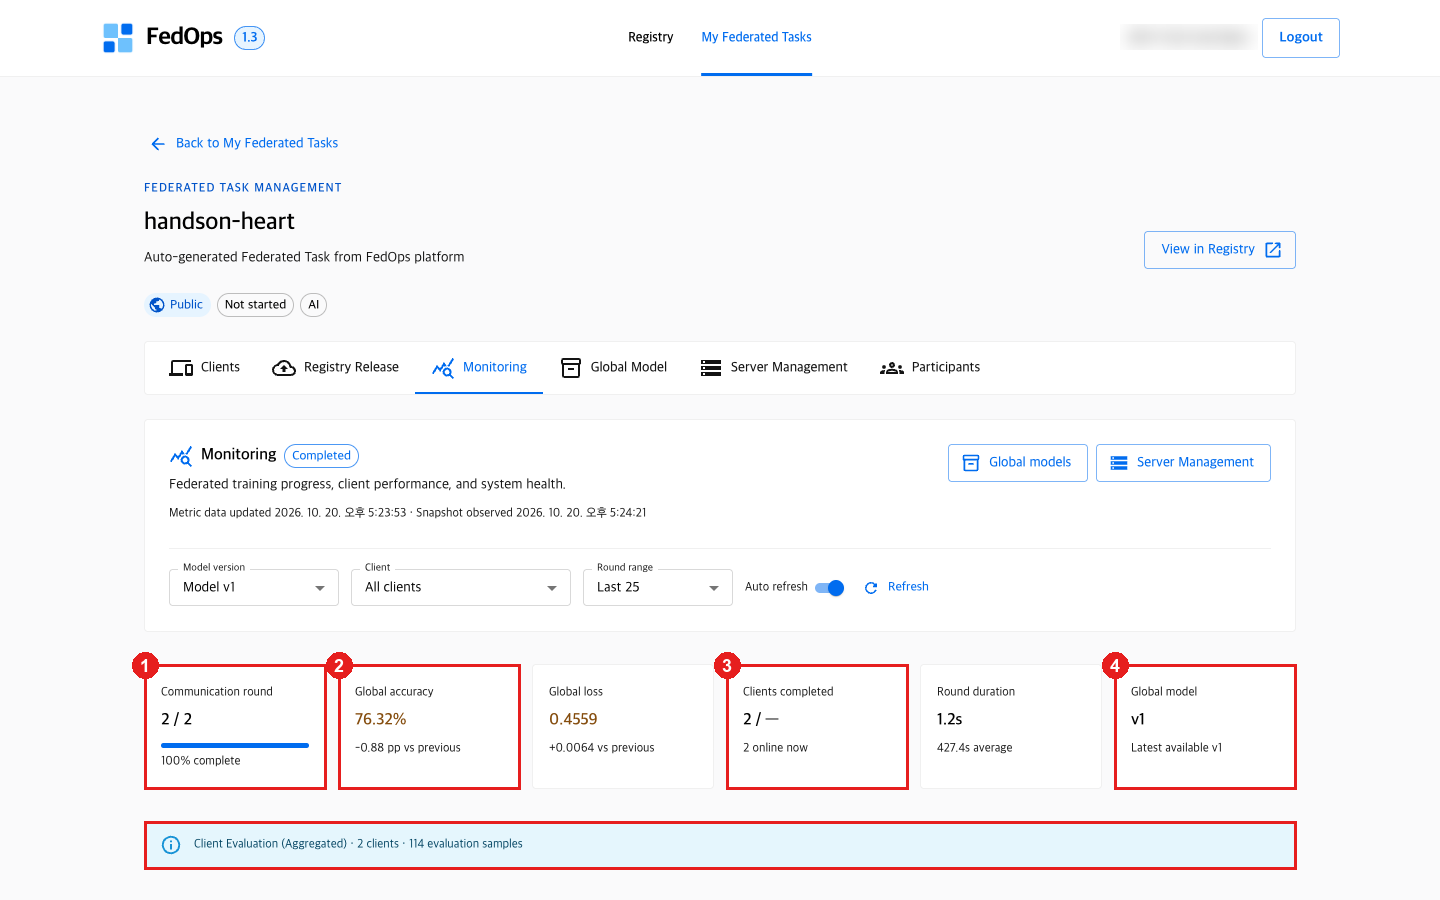
Monitoring shows Communication round 2 / 2 · 100% complete, Global accuracy · Global loss, and the number of Clients that finished training. ① rounds, ② Global accuracy, ③ number of Clients that finished, ④ the new Global Model version. 2 clients · 114 evaluation samples in the blue bar below is the total test rows of both hospitals (Hungary 53 + Cleveland 61).
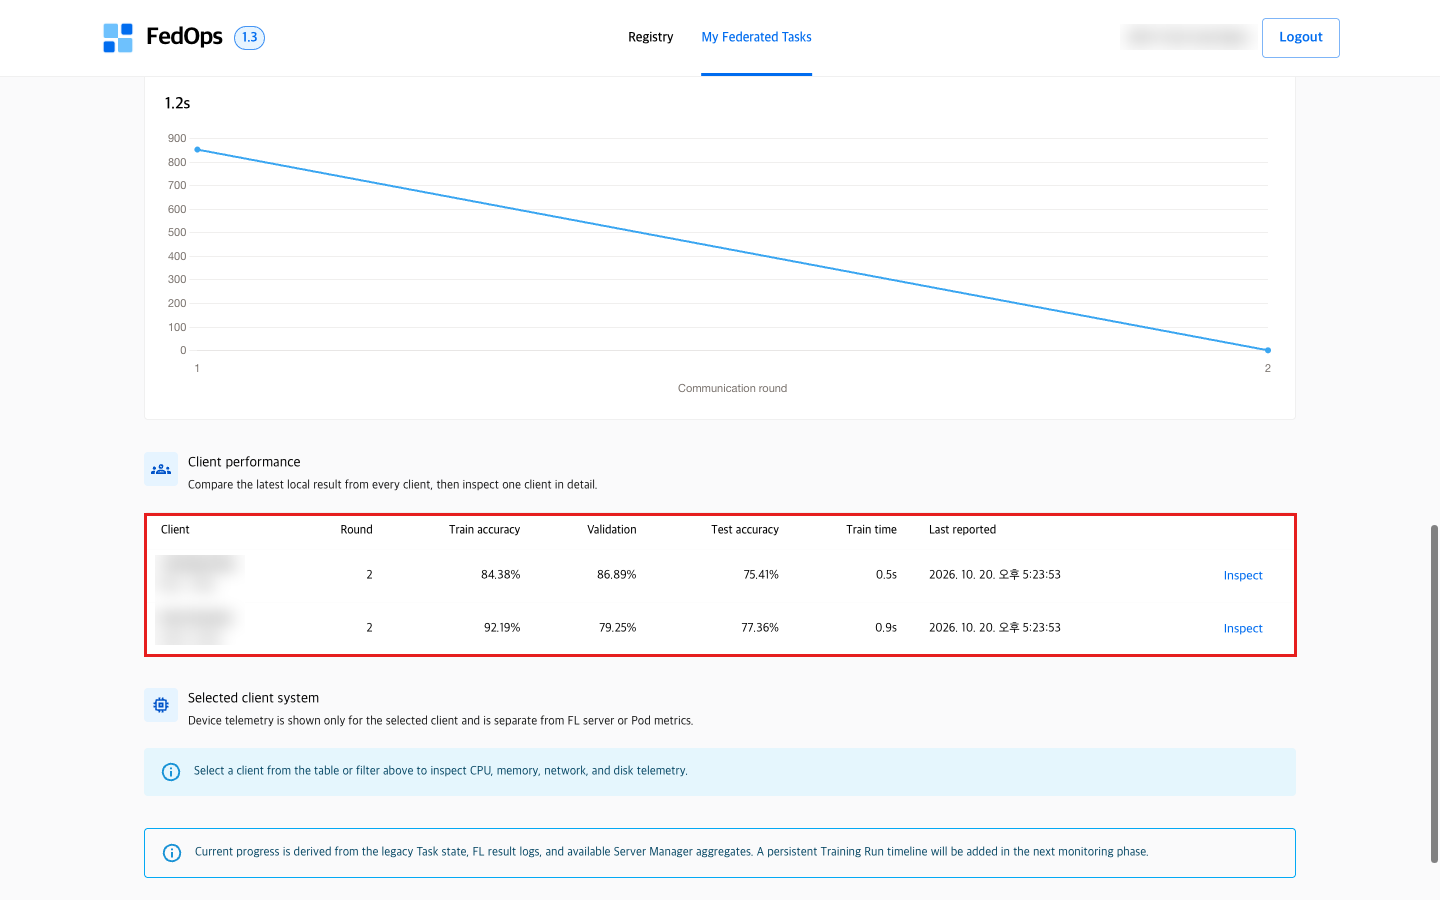
The Client performance table further down shows one row of metrics per participant. Clients are shown by device ID, not by name.
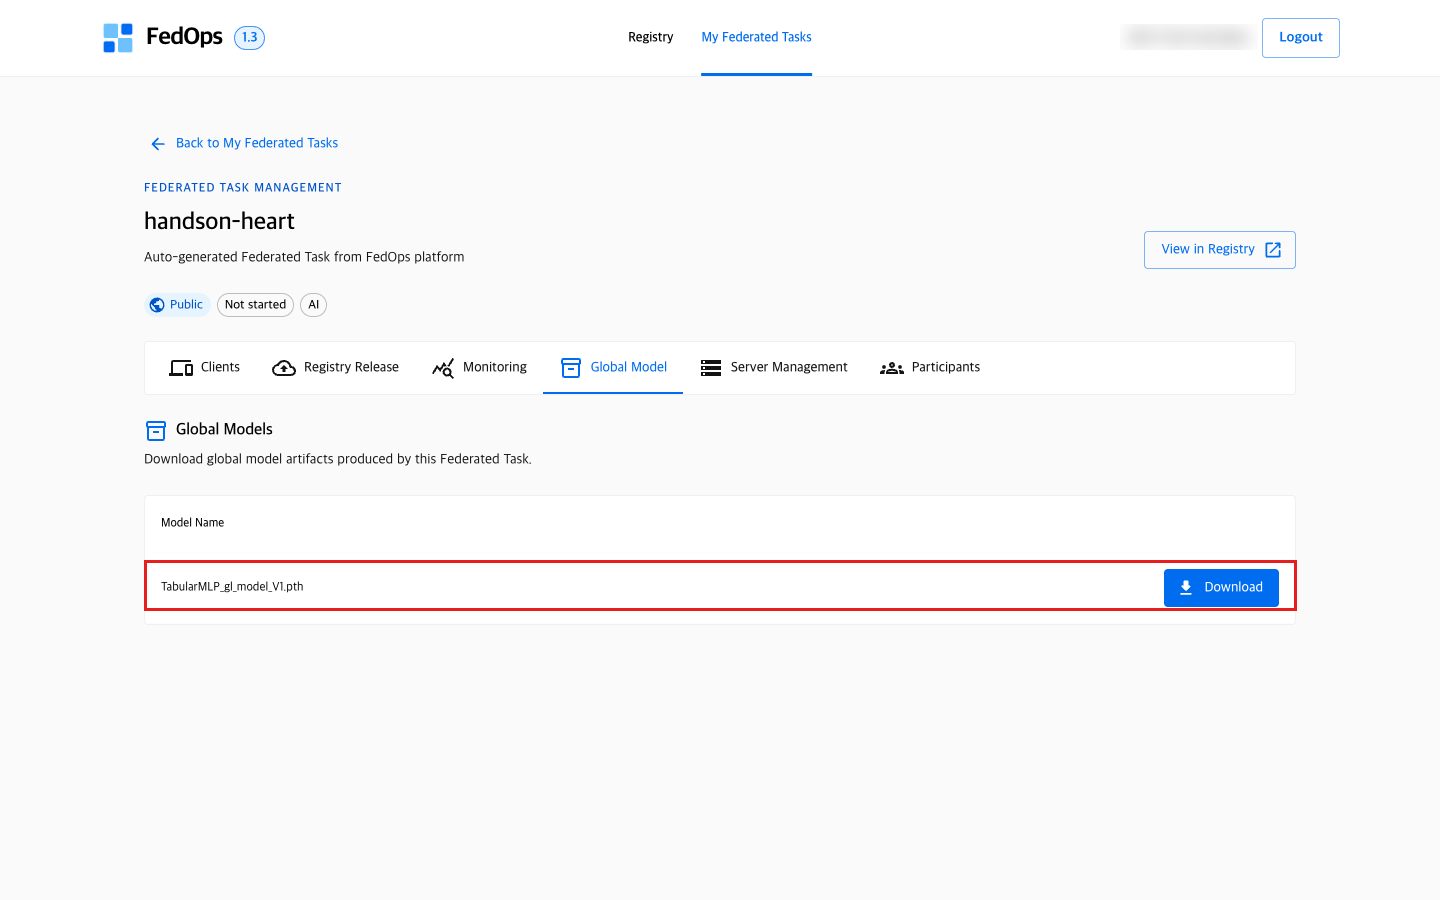
After the first campaign, TabularMLP_gl_model_V1.pth appears in the Global Model tab, and each further campaign adds V2, V3, …. The Agent in the Model Use Track uses this model.
⚙️ Explained — what Monitoring shows
| Item | How to read it |
|---|---|
| Campaign run · Communication round | Which round of which run is in progress |
| Clients completed / online | Clients that finished this round / Clients connected. Start here if a round seems stuck |
| Global accuracy · Global loss | Global Model scores per round (computed by the Global model evaluation method in chapter 6) |
| Round duration | Time per round. The slowest Client decides it |
| Per-Client metrics | Pick a Client to see the local metrics it allowed to share |
2) Read the numbers
| Where | Value |
|---|---|
| Console Monitoring | Global accuracy 76.32%, Global loss 0.4559 (weighted average over 114 test rows of both hospitals) |
| Studio federated learning screen (Owner) | Accuracy 77.36%, F1 No Disease 81.25%, F1 Disease 71.43% (53 Hungarian test rows) |
| Console Global Model | TabularMLP_gl_model_V1.pth |
What to check. In this tutorial, what matters is not the size of the numbers but these three things:
- Rounds reached
2 / 2— the server waited for both hospitals’ training and merged it - Client performance has two rows — both hospitals took part in training
- A new version appeared in Global Model — one model was built without moving data
(Two-account run, 2026-10-20) From the Hungarian side, compared with the Initial Model of chapter 4 (accuracy 0.7736, F1 Disease 68.42%), accuracy stayed the same and F1 Disease rose from 68.42% → 71.43%. With the Cleveland data added, the model catches heart disease patients a little better.
What numbers are normal. This data is around 0.75–0.8 accuracy by nature, and training the two hospitals together raises it only a little. A simulation with the same settings (average of 20 seeds, on the Hungarian test set) gave:
| Comparison | Hungarian test accuracy |
|---|---|
| Owner alone, first model (Initial Model) | about 0.76 |
| Owner + Client federated learning, 2 rounds (starting from the Initial Model) | about 0.78 |
| If we could pool (training on both hospitals’ data combined) | about 0.79 |
A single run may not improve. In the simulation above, federated learning beat the Owner alone in 14 of 20 runs (70%), tied in 1, and was worse in 5. The Hungarian test set has around 90 rows, so getting one or two patients differently right moves the score by 1–2 percentage points. Even if the numbers differ from what you expect, federated learning worked correctly if the three things above are confirmed.
How to judge: if the Global Model built by the Owner and Client together is similar to or a little better than the Owner’s solo Initial Model, and close to chapter 1’s “if we could pool”, federated learning did its job. It means the Cleveland hospital’s data was reflected in the model without leaving the hospital.
3) Next campaign and cleanup
| Goal | How |
|---|---|
| Run another round of training | Save the campaign again and Start FL server. It starts from the previous Global Model vN and produces vN+1. Both sides redo the readiness check every time the server starts (chapter 6) |
| Change the code and redo | Go back to Owner Track ch. 4, publish a new Release (revision 2), then run a campaign |
| Practice finished | Pause in Server Management to return server resources |
| Withdraw publication | Task actions → Delete task (cannot be undone) |
📚 Federated learning background — careful when reading metrics
- Client metrics use a different yardstick per Client. With Validation OFF, each Client scores on its own test data. The Hungarian hospital has 62% no heart disease, so saying “none” for everyone already gives 0.62 accuracy. So look not only at accuracy but also at metrics that catch heart disease patients, such as F1 Disease.
- Federated learning run alone is not the effect of federation. If the Owner alone ran 2 rounds and improved, that is the effect of training more on the same data.
- There is no guarantee the Global Model is good for every hospital. It may be good on average yet worse at a particular hospital than that hospital’s solo model. In this data too, adding a very different site such as the VA hospital (78% heart disease) often lowered performance on the Owner’s data. Personalized federated learning (personalized FL) is the field that deals with this.
✅ Checklist
- You saw rounds advance in the live log
- Console Monitoring shows
2 / 2rounds completed - Client performance has rows for both hospitals
- A new version (v1) appeared in the Global Model tab
- You paused the server when done
Next
- To plug this Global Model into a service → Model Use Track
- To see what the Client went through → Client Track